English
 Pусский
 Español
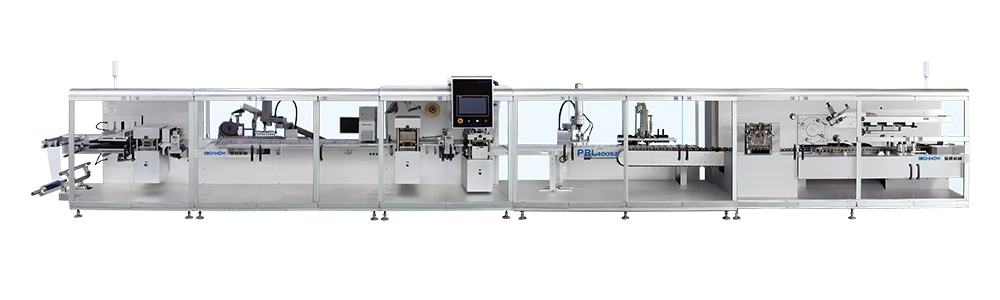
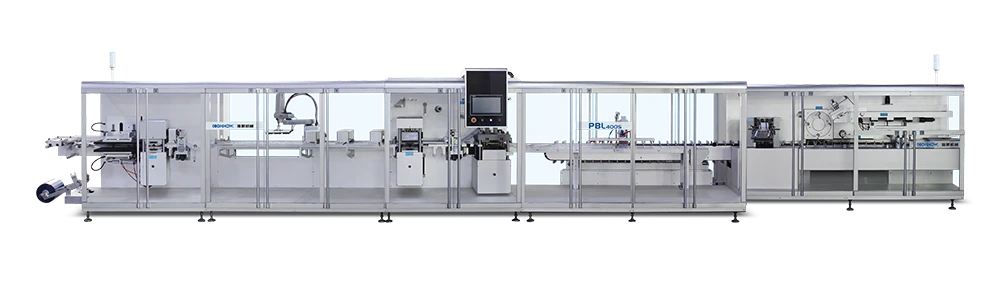
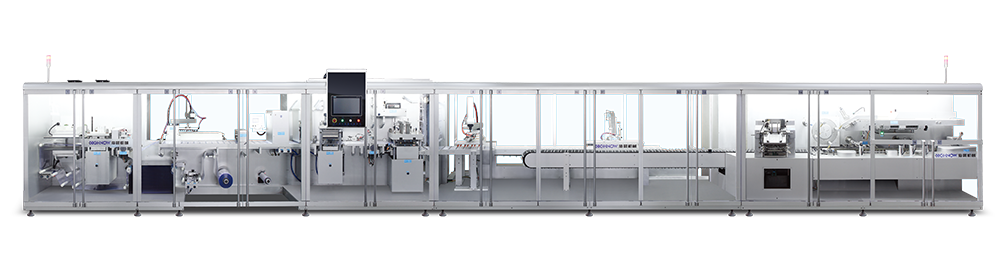
OEE is the standard measure of how effectively a blister line for vial product converts planned production time into good product. It is calculated as Availability × Performance × Quality. The number itself is less important than the loss categories behind it. This guide explains how to calculate each factor, how to define planned production time, how to map the six big losses to a vial blister line, how to collect reliable data, and how to set a benchmark that is realistic for your product mix.
What OEE Actually Measures
OEE combines three ratios into one number:
- Availability = Run Time ÷ Planned Production Time
- Performance = (Ideal Cycle Time × Total Count) ÷ Run Time
- Quality = Good Count ÷ Total Count
OEE = Availability × Performance × Quality
The formula is simple. The difficulty is in the definitions. Two plants can report the same OEE number while measuring different things. Before comparing OEE across shifts, lines, or suppliers, agree on the definitions below.
Defining Planned Production Time
Planned production time is the time the line is scheduled to run, excluding planned breaks, planned maintenance, and planned cleaning. Everything else is a loss.
A practical definition for a vial blister line:
| Time category | Included in planned production time? | Notes |
|---|---|---|
| Scheduled shift | Yes | Base for calculation |
| Planned break | No | Excluded from planned time |
| Planned cleaning | No | Excluded from planned time |
| Planned maintenance | No | Excluded from planned time |
| Unplanned breakdown | Yes | Counted as availability loss |
| Changeover | Yes | Counted as availability loss |
| Material shortage | Yes | Counted as availability loss |
| Minor stop | Yes | Counted as performance loss |
| Speed loss | Yes | Counted as performance loss |
| Reject | Yes | Counted as quality loss |
The key discipline is consistency. If one shift excludes changeover from planned time and another includes it, their OEE numbers are not comparable.
Mapping the Six Big Losses to a Vial Blister Line
The six big losses are the standard loss categories behind OEE. The table below maps each loss to a vial blister line and shows where it is measured.
| Loss category | OEE factor | Vial blister line example | Where to measure |
|---|---|---|---|
| Equipment failure | Availability | Sealing station fault, punching station stop | PLC alarm log, maintenance record |
| Setup and adjustment | Availability | Format change from 2 ml to 10 ml vial | Changeover log |
| Idling and minor stops | Performance | Vial misorientation, feeder jam cleared in seconds | PLC stop counter, operator log |
| Reduced speed | Performance | Line running below rated cycles/min | PLC speed data vs rated speed |
| Process defects | Quality | Seal defect, missing vial, damaged blister | Inspection system, QC record |
| Reduced yield | Quality | Startup scrap, material waste during tuning | Production record, material issue |
For a vial blister line, the most under-measured losses are usually minor stops and reduced speed. Both fall under performance, and both are often invisible if the PLC only records major faults. A line can appear to have high availability while performance is quietly dragging OEE down.
How to Collect Reliable OEE Data
OEE is only as good as the data behind it. Three data sources matter:
PLC and SCADA data. Cycle counts, stop events, alarm codes, and speed setpoints. This is the most objective source, but it needs clean tagging. If the PLC does not distinguish between a planned stop and an unplanned stop, the availability calculation will be wrong.
Operator input. Reason codes for stops, changeover start and end, and minor stops that are too short for the PLC to capture reliably. Operator input should be simple and fast, otherwise, it will be skipped.
Quality records. Reject counts, rework, and first-article inspection results. If rejects are removed manually and not counted, the quality factor will be overstated.
A practical data collection setup for a vial blister line:
- Automatic cycle count from the blister machine PLC
- Automatic stop event with duration and alarm code
- Manual reason code selection at the HMI for stops above a defined threshold
- Automatic reject count from the inspection system
- Manual changeover start and end confirmation
- Daily reconciliation between PLC count and packed carton count
Setting a Realistic OEE Benchmark
There is no universal OEE number. A line running one product on three shifts has a different achievable OEE than a line running five formats with frequent changeovers.
HIGHNOW's pharmaceutical industry page lists a target OEE of ≥88% for validated vial packaging lines under defined conditions. That is a reference point, not a universal promise. Actual OEE depends on:
- Product mix and batch size
- Changeover frequency
- Container fragility
- Operator skill and training
- Maintenance discipline
- Material consistency
- Inspection and rejection settings
A practical approach is to set the benchmark in three tiers:
| Tier | Basis | Use |
|---|---|---|
| Baseline | First 30 days of production data | Establish current performance |
| Improvement target | Baseline plus a defined loss-reduction goal | Drive continuous improvement |
| Acceptance benchmark | Agreed with supplier for FAT/SAT | Verify line capability |
For supplier acceptance, the benchmark should be tied to a defined product, a defined shift pattern, and a defined run duration. A four-hour continuous run with a defined product mix is more meaningful than a short demonstration at rated speed.
Building an OEE Dashboard
An OEE dashboard should answer three questions:
- What was OEE last shift, last day, last week?
- Which loss category drove the gap?
- What action was taken?
A minimal dashboard for a vial blister line:
| Metric | Frequency | Owner |
|---|---|---|
| OEE | Shift, daily, weekly | Production manager |
| Availability | Shift, daily | Line supervisor |
| Performance | Shift, daily | Line supervisor |
| Quality | Shift, daily | QC |
| Top three stop reasons | Daily | Maintenance and production |
| Changeover time | Per event | Line supervisor |
| Reject rate by format | Daily | QC |
The dashboard should not be a reporting exercise. Each loss category should have an owner and a follow-up action. If the top stop reason is feeder jam, the action belongs to maintenance and engineering. If the top loss is changeover, the action belongs to production and process engineering.
Using OEE Data to Drive Improvement
OEE improvement follows a simple loop:
- Measure. Collect data with consistent definitions.
- Prioritize. Rank loss categories by impact on OEE.
- Analyze. Find the root cause of the top loss.
- Act. Implement a countermeasure.
- Verify. Confirm the loss category moved.
- Standardize. Update the SOP and training.
For a vial blister line, common improvement actions include:
- SMED for changeover
- Feeder tuning and buffer optimization for minor stops
- Servo tuning and speed setpoint review for reduced speed
- Inspection and sealing parameter review for quality losses
- Preventive maintenance for equipment failures
For line-level integration context, review the vial blister line configurations. For validation and service support, review the service page.
OEE and TCO: How They Connect
OEE is not only an operational metric. It directly affects the financial case for a line. Higher OEE means more good units from the same planned time, which improves the cost per unit and shortens the payback period.
A simple illustration: if two lines have the same CAPEX but one runs at 75% OEE and the other at 88% OEE, the higher-OEE line produces more good units per shift. Over a year, that difference is significant. This is why OEE should be part of the supplier comparison, not only a post-installation KPI.
FAQ
What is a good OEE for a vial blister line?
There is no universal number. A validated line may target OEE ≥88% under defined conditions, but actual achievable OEE depends on product mix, batch size, changeover frequency, and maintenance discipline. Set a baseline first, then set improvement targets.
How is availability calculated for a vial blister line?
Availability = Run Time ÷ Planned Production Time. Planned production time excludes planned breaks, planned cleaning, and planned maintenance. Changeover and unplanned stops are counted as availability losses.
What are the six big losses?
Equipment failure, setup and adjustment, idling and minor stops, reduced speed, process defects, and reduced yield. The first two are availability losses, the middle two are performance losses, and the last two are quality losses.
How often should OEE be measured?
Measure at shift level for operational control, daily for trend review, and weekly or monthly for management review. The measurement frequency should match the decision cycle.
Can OEE be compared between different lines?
Only if the definitions of planned time, run time, total count, and good count are identical. Different product mixes and batch sizes also affect OEE, so comparisons should be made within a similar production context.
Conclusion
OEE is a simple formula with difficult definitions. Agree on planned production time, map the six big losses to your line, collect reliable data from the PLC, operators, and quality records, and set a benchmark that reflects your product mix. Use the dashboard to prioritize losses, not just to report a number. When evaluating a new line, ask the supplier how OEE is defined and how it will be verified during acceptance. Review the available blister line for vial product configurations and discuss your production data with our engineers at the contact page.
Related Reading
- Vial Blister Line Integration & OEE Playbook: Upstream, Downstream, PLC/OPC UA, Changeover
- Vial Blister Packaging Line TCO & ROI: 7-Year Cost Model and Payback Benchmarks
- How Does a Vial Blister Packaging Line Work?
- 7 Questions Before Buying a Pharma Blister Line
- 5 Hidden Costs of Cheap Vial Blister Machines