English
 Pусский
 Español
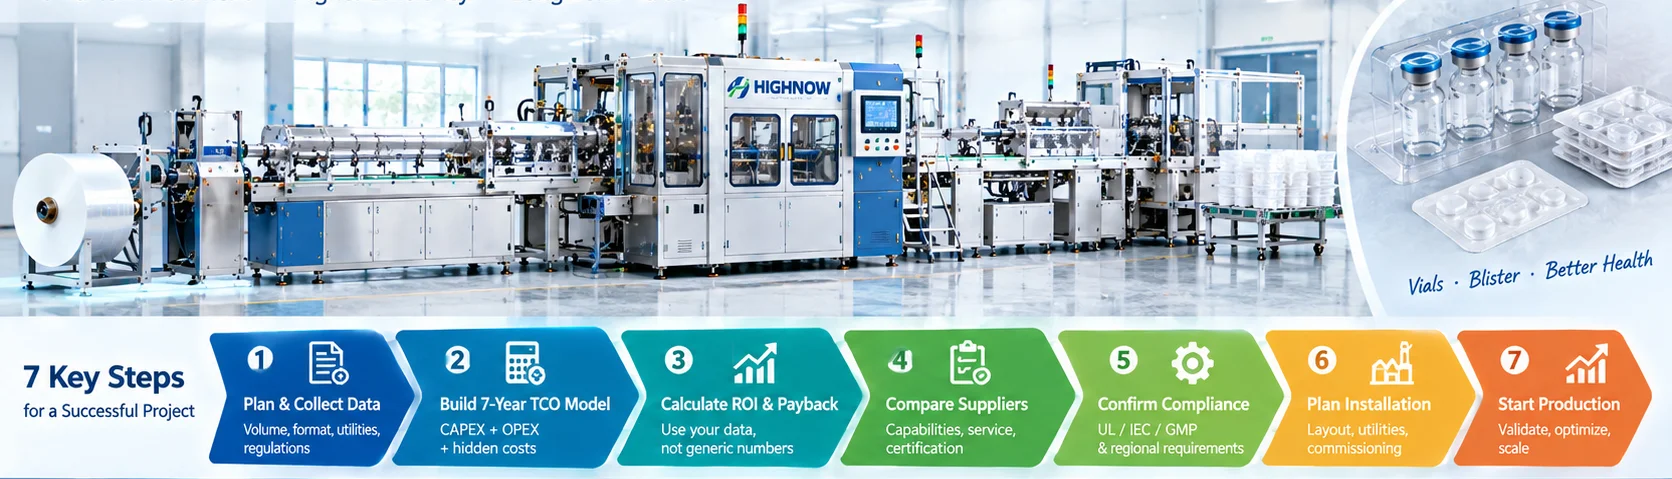
A vial blister packaging line should be evaluated by total cost of ownership, not purchase price alone. The most important factors are annual volume, OEE, changeover frequency, reject rate, energy use, spare parts, validation support, and labor.
This guide explains how to build a 7-year TCO model, calculate ROI and payback, compare supplier quotes, and identify hidden costs before you invest.
Why Purchase Price Is Not the Decision Basis
In packaging line projects, the initial quote is only the first number. Two lines with similar CAPEX can have very different 7-year costs if one has longer changeover, higher reject rates, more frequent spare parts, or weaker remote support.
A practical TCO review asks:
- What is the delivered and installed cost?
- What is the expected OEE under our product mix?
- How long does a format change take?
- What consumables and spare parts are required?
- What validation and documentation support is included?
- What happens when the line stops?
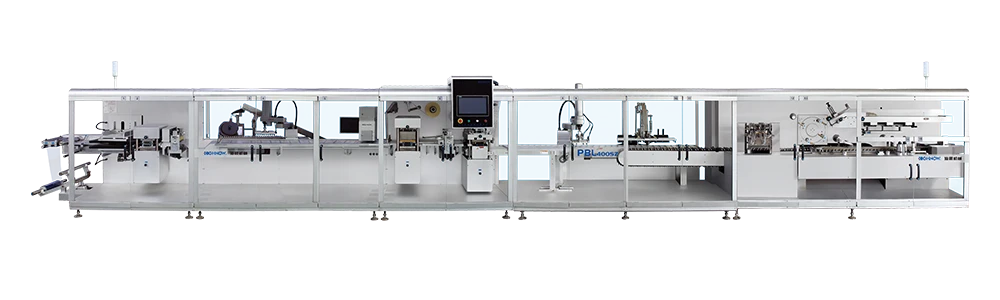
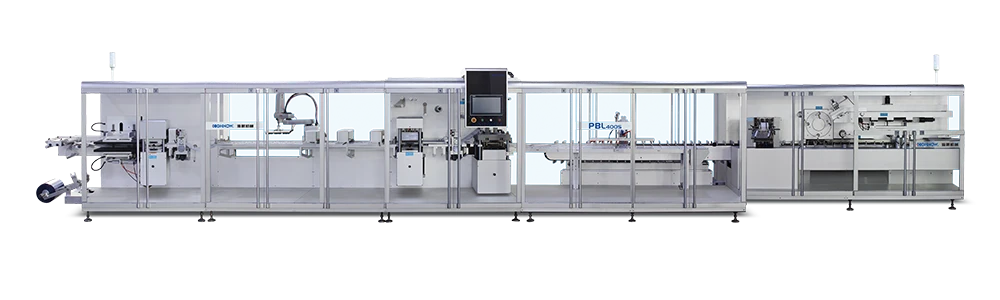
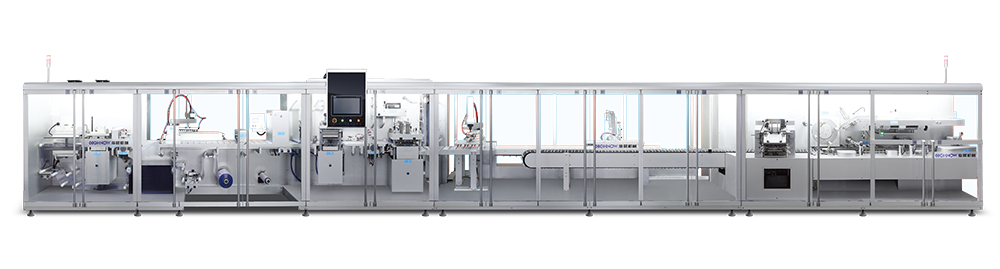
For a broader view of line structure and modular options, review the available blister line configurations.
What a 7-Year TCO Model Should Include
A 7-year TCO model converts many small operational details into one financial picture. The exact values depend on your plant, product, shift pattern, and local costs. Use the table below as a data-collection framework.
| Cost category | What to include | Data to request from supplier | Why it matters |
|---|---|---|---|
| CAPEX | Machine, tooling, conveyors, installation, commissioning | Scope of supply, utility requirements, installation plan | Defines the base investment |
| Utilities | Electricity, compressed air, water, chilled water | Connected load, average consumption, air quality requirements | Small per-hour costs become large over 7 years |
| Consumables | PVC, aluminum foil, cartons, leaflets, glue, tape | Material compatibility, forming window, sealing parameters | Directly affects unit cost and waste |
| Labor | Operators, technicians, supervision, training | Recommended crew size, training hours, maintenance level | Labor savings are a major ROI driver |
| Changeover | Format change time, tooling, cleaning, line purge | Changeover procedure, tool-free features, recipe control | Long changeover reduces effective capacity |
| Quality and rejects | Reject rate, rework, product loss, recall risk | Inspection options, rejection logic, audit trail | Rejects can erase apparent savings |
| Maintenance | Preventive maintenance, wear parts, lubrication | Maintenance schedule, spare parts list, recommended stock | Predictable maintenance lowers downtime |
| Spare parts | Critical parts, lead time, availability | 24-hour or 48-hour availability, regional stock | Long lead times increase downtime cost |
| Validation | IQ/OQ/PQ, FAT/SAT, documentation, audit support | Validation package, GAMP 5 documentation, 21 CFR Part 11 support | Required for regulated markets |
| Training | Operator training, maintenance training, refresher | On-site training, remote support, training materials | Reduces human error and unplanned stops |
| Downtime | Lost output, overtime, delayed batches | MTBF data, response time, remote diagnostics | Often the highest hidden cost |
| End-of-life | Upgrade path, retrofit, resale, disposal | Modular design, software upgrade, spare parts lifetime | Protects long-term asset value |
ROI and Payback Calculation
Use your own production data. Do not rely on generic percentages.
ROI formula
ROI = (Total Annual Savings − Total Annual Operating Costs) ÷ Total Investment × 100%
Payback period formula
Payback Period = Net Investment ÷ Average Annual Net Savings
OEE formula
OEE = Availability × Performance × Quality
OEE is central because it connects technical performance to financial return. If availability drops due to changeover or maintenance, or if quality drops due to rejects, the payback period extends.
HIGHNOW's pharmaceutical industry page lists a target OEE of ≥88% for validated vial packaging lines under defined conditions. Actual results depend on product format, batch size, shift pattern, operator skill, and maintenance discipline. Buyers should verify OEE through a factory acceptance test and a performance qualification run.
Capacity Planning Inputs by Model
The table below uses published HIGHNOW model data as planning inputs. It is not a price list. Use it to match line capacity to your batch plan.
| Model | Punching frequency | Boxing capacity | Planning scenario |
|---|---|---|---|
| PBL-400S-500SF | 16–35 times/min, 1–4 plates/time | 400 boxes/min | High-output cartridge or vial line with cartoning |
| PBL-400SZ | 16–35 times/min, 1–12 plates/time | 200–350 boxes/min | Flexible high-speed line for multiple formats |
| PBL-400S | 16–35 times/min, 1–12 plates/time | 60–80 boxes/min | Vials, ampoules, oral liquids, shaped bottles |
| PBL-350/120CA | 30 times/min | 60–80 boxes/min | Compact vial packing with ten-blister format |
| PBL-600-500S | 16–30 times/min, 1–4 plates/time | 400 boxes/min | Oral liquid and ampoule vial packing |
| PBL-350/400 | 16–30 times/min, 1–4 plates/time | 250 boxes/min | Oral liquid, ampoule, and vial production |
To review specific machine configurations, compare related models.
Supplier Quote Comparison Template
Ask every supplier to complete the same data set. This prevents a low headline price from hiding missing scope.
| Item | Required information |
|---|---|
| Scope of supply | Machine, tooling, conveyors, safety guards, controls |
| Utility requirements | Power, air, water, chilled water, exhaust |
| Format range | Vial diameter, height, fill volume, blister layout |
| Speed | Cycles per minute, plates per cycle, cartons per minute |
| Changeover | Time, tools required, recipe storage, training |
| Reject handling | Detection method, rejection rate, rework path |
| Inspection | Vision, leak, weight, missing component, label |
| Data | PLC type, OPC UA, audit trail, 21 CFR Part 11 |
| Validation | FAT, SAT, IQ/OQ/PQ, documentation package |
| Training | Hours, location, language, materials |
| Spare parts | Recommended stock, lead time, availability |
| Service | Remote support, response time, on-site support |
| Warranty | Duration, coverage, exclusions |
| Upgrade path | Retrofit, software, capacity expansion |
For integration with cartoning and end-of-line equipment, review the automatic cartoning machine and automatic case packer.
Hidden Cost Audit Checklist
- Changeover time under real production conditions
- Format change tooling and storage
- Annual spare parts consumption
- Critical spare parts lead time
- Energy consumption at average and peak load
- Compressed air quality and consumption
- Reject rate by format and product
- Product loss during startup and shutdown
- Validation documentation and audit support
- Operator and maintenance training hours
- Remote diagnostics and software update policy
- Line integration with upstream filler and downstream cartoner
- Cleaning and washdown requirements
- GMP documentation and material traceability
- OEE measurement method and reporting
Decision Matrix: Which Line Fits Your Factory
| If your priority is | Focus on | Review |
|---|---|---|
| Lowest 7-year cost | OEE, changeover, spare parts, energy | TCO model and service terms |
| High output | Punching frequency, cartoning capacity | PBL-400S-500SF, PBL-400SZ |
| Flexible batch sizes | Changeover time, recipe control, feeder options | Small bottle feeder |
| Regulated markets | Validation, audit trail, documentation | Quality and service |
| End-of-line automation | Cartoner, bundler, case packer integration | Automatic cartoning and case packing |
| Future expansion | Modular design, retrofit, software | Custom and auxiliary equipment |
To discuss your production data and line configuration, contact our engineers.
Frequently Asked Questions
What is a typical payback period for a vial blister packaging line?
Payback depends on annual volume, OEE, labor savings, reject reduction, changeover time, and local operating costs. Use the payback formula with your own data, and verify assumptions through a factory acceptance test.
Which TCO cost is most often underestimated?
Changeover, validation, spare parts, energy, and training are frequently underestimated. These costs may not appear in the initial quote but affect the line every year.
How do you calculate OEE for a vial blister line?
OEE = Availability × Performance × Quality. Measure each factor over a defined production period and use the same definition when comparing suppliers.
Is a high-speed line always better for ROI?
Not always. A high-speed line may have higher changeover time, higher energy use, or higher spare parts cost. The right choice depends on batch size, product mix, and utilization.
What data should we prepare before requesting a TCO model?
Prepare annual volume, batch size, vial format, shift pattern, labor rate, utility cost, waste rate, changeover frequency, target OEE, and regulatory market requirements.
Conclusion
The strongest investment decision is based on 7-year TCO, verified OEE, and a normalized supplier quote. Avoid comparing only purchase price. Confirm changeover, rejects, spare parts, validation, energy, and service terms. When the data is complete, review the available line configurations and discuss your production requirements with our team.