English
 Pусский
 Español
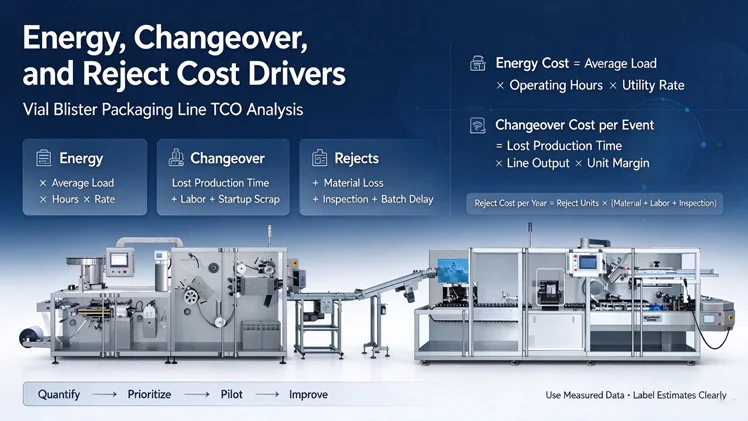
Most vial blister line cost discussions focus on the purchase price. In operation, three cost drivers decide whether the line performs financially: energy, changeover, and rejects. Each one is easy to underestimate because it is spread across shifts and does not appear as a single invoice. This guide explains how to quantify each driver, how they interact, and how to prioritize improvement actions before they are built into a TCO model.
Why These Three Drivers Matter
A vial blister line uses energy continuously, stops for changeover regularly, and produces some rejects every shift. None of these costs is dramatic on its own. Over a year, they compound.
-
Energy cost is driven by connected load, average load, compressed air, chilled water, and sealing heat.
-
Changeover cost is driven by lost production time, labor, startup scrap, and schedule disruption.
-
Reject cost is driven by material loss, labor, inspection time, and potential batch delays.
For the full TCO structure, review the 7-year TCO framework. This article focuses on the three drivers inside that framework.
Energy Cost: What Actually Drives the Bill
Energy cost in a vial blister line comes from several sources, not just the main motor.
Main contributors:
-
Servo motors and drives
-
Sealing and forming heaters
-
Vacuum pumps
-
Compressed air generation
-
Chilled water for cooling
-
Cleanroom HVAC (if the line is inside a cleanroom)
The connected load is not the same as the average load. A line rated at a certain connected kW may run at a much lower average load during normal production, and at a higher load during startup and heating. For cost estimation, use average load over a production shift, not the nameplate value.
How to estimate energy cost:
Energy Cost = Average Load (kW) × Operating Hours × Utility Rate
For compressed air, the cost is often higher than electricity per unit of energy because air generation is inefficient. If the line uses air blow-off, vacuum generation, or pneumatic actuators, include compressed air in the energy estimate.
Practical inputs to collect:
| Input | Source | Notes |
|---|---|---|
| Connected load | Supplier datasheet | Nameplate value |
| Average load | Power meter or supplier estimate | Use measured data if available |
| Operating hours | Production plan | Per year |
| Utility rate | Utility bill | Per kWh |
| Compressed air consumption | Supplier datasheet | Normal liters per minute |
| Air cost per Nm³ | Plant engineering | Includes generation efficiency |
| Chilled water demand | Supplier datasheet | If applicable |
| Sealing heat duty | Supplier datasheet | If separately metered |
Where measured data is not available, use supplier estimates and clearly label them as estimates in the TCO model. For line-level utility requirements, the vial blister packaging machine specifications are the reference.
Changeover Cost: The Hidden Capacity Loss
Changeover cost is not only the labor hours spent adjusting the line. It is the production time lost, the startup scrap produced, and the schedule disruption caused.
How to estimate changeover cost:
Changeover Cost per Event =
(Lost Production Time × Line Output × Unit Margin)
-
Labor Cost
-
Startup Scrap Cost
Example structure:
| Component | How to measure | Notes |
|---|---|---|
| Lost production time | Measured changeover duration | Use actual time, not brochure time |
| Line output | Rated output adjusted for OEE | Good units per hour |
| Unit margin | Finance data | Gross margin per unit |
| Labor cost | Fully loaded hourly rate × crew size × duration | Include technicians if involved |
| Startup scrap | Units scrapped during ramp-up × material cost | Include cartons and leaflets |
| Schedule disruption | Estimate of delayed batches or overtime | Use finance input |
Changeover cost grows quickly in multi-format facilities. A line running five formats with frequent changes will have a much higher annual changeover cost than a line running one format on long campaigns. This is why changeover time should be part of the TCO model, not only an operational KPI.
For line configuration options that reduce changeover, review the blister lines for vial product range. For the cartoning module, the automatic cartoning machine page describes the format change scope.
Practical improvement levers:
-
SMED: separate internal and external tasks
-
Recipe-driven servo adjustment
-
Quick-release tooling and color-coded parts
-
Pre-staged cartons and leaflets
-
Standardized first-article inspection
Reject Cost: More Than Material Loss
Reject cost includes material loss, labor, inspection time, and potential batch delays. In regulated markets, rejects also carry documentation and investigation cost.
How to estimate reject cost:
Reject Cost per Year =
Reject Units × (Material Cost + Labor Cost + Inspection Cost)
-
Batch Delay Cost (if applicable)
Common reject sources in a vial blister line:
-
Seal defects
-
Missing or misoriented vials
-
Damaged blisters
-
Carton or leaflet errors
-
Label or print errors
Startup scrap is a separate category. It occurs during ramp-up after changeover or after a stop. Startup scrap is often larger than steady-state rejects, especially in multi-format lines.
Practical inputs to collect:
| Input | Source | Notes |
|---|---|---|
| Reject rate | Quality records | By format and product |
| Reject units per year | Production data | Based on total output |
| Material cost per unit | Procurement | Include all components |
| Labor cost per reject | Finance estimate | Handling and rework |
| Inspection cost | Quality | If rejects require investigation |
| Startup scrap rate | Production records | Per changeover event |
| Batch delay cost | Finance | If rejects delay release |
For reject reduction, the quality documentation and the inspection options described on the product pages are the starting point. The service page covers spare parts and technical support for inspection systems.
How the Three Drivers Interact
The three drivers are not independent. A long changeover increases startup scrap, which increases reject cost. A high reject rate increases the effective energy cost per good unit because more energy is spent per accepted unit. A line running below rated speed increases energy cost per unit and reduces output, which increases the cost of changeover time.
This interaction is why cost improvement should be prioritized by total effect, not by individual driver. A small reduction in changeover time can reduce both changeover cost and startup scrap. A small reduction in reject rate can improve both quality cost and energy cost per good unit.
Prioritizing Improvement Actions
A practical prioritization method:
-
Quantify each driver using the formulas above.
-
Estimate the improvement potential for each driver.
-
Estimate the implementation cost for each action.
-
Rank by annual net benefit.
-
Verify with a pilot before full rollout.
A simple ranking table:
| Driver | Annual cost | Improvement potential | Implementation cost | Priority |
|---|---|---|---|---|
| Energy | Calculated | 5–15% typical range | Low to medium | Medium |
| Changeover | Calculated | 20–50% typical range | Medium | High |
| Rejects | Calculated | 10–40% typical range | Medium to high | High |
The ranges above are typical planning ranges, not guarantees. Actual potential depends on the current baseline, product mix, and line configuration. Confirm with measured data before committing to a target.
Building the Three Drivers into the TCO Model
Once quantified, the three drivers should be entered into the TCO model as annual cost lines. Use the same definitions across suppliers so the comparison is fair.
A practical structure:
| TCO line | Driver | Basis |
|---|---|---|
| Energy cost | Energy | Average load × hours × rate |
| Compressed air cost | Energy | Air consumption × air cost |
| Changeover cost | Changeover | Events per year × cost per event |
| Startup scrap cost | Changeover and reject | Changeover events × scrap per event |
| Steady-state reject cost | Reject | Reject units × cost per reject |
| Inspection and investigation cost | Reject | Quality records |
FAQ
Which of the three drivers usually has the largest cost impact?
Changeover and rejects typically have the largest impact in multi-format facilities. Energy is usually smaller per unit but still worth measuring, especially where compressed air and chilled water are used.
How do I measure average load if the supplier only provides connected load?
Use a power meter on the line for one full production shift. If that is not possible, ask the supplier for an average load estimate and label it as an estimate in the model.
Is startup scrap part of reject cost or changeover cost?
It can be assigned to either, but it should not be counted twice. A common approach is to assign startup scrap to changeover cost, because it is caused by the changeover event.
How often should these costs be recalculated?
Recalculate annually, or whenever the product mix, line configuration, or utility rates change significantly. Use measured data where available.
Can these drivers be reduced without new equipment?
Yes. SMED, recipe management, feeder tuning, sealing parameter review, and inspection settings can reduce all three drivers without major capital investment. Confirm the expected benefit with a pilot run.
Conclusion
Energy, changeover, and rejects are the three cost drivers most often underestimated in vial blister line projects. Quantify each one with measured data where possible, label estimates clearly, and enter them into the TCO model as annual cost lines. Prioritize improvement actions by annual net benefit, and verify with a pilot before full rollout. For line configuration options, review the available blister lines for vial product configurations. To discuss your cost data and improvement priorities, contact our engineers at the contact page.
Related Reading
-
Vial Blister Packaging Line TCO & ROI: 7-Year Cost Model and Payback Benchmarks
-
OEE Calculation for Vial Blister Lines: Availability, Performance, Quality and the Six Big Losses
-
Vial Blister Line Integration & OEE Playbook: Upstream, Downstream, PLC/OPC UA, Changeover
-
Small Bottle Feeder Selection & Integration Guide for Vial, Ampoule, Cartridge and Syringe Lines